

Skip to content
Connecting Industry · Industrial information & services
Industrial Indicators

Read the market in numbers.

The latest readings that matter to manufacturers and investors, taken from official and industry releases and linked to every source.

Latest readings

6 indicators tracked

Warehouse with forklifts and pallets of goods
47.2indexOctober 2026 · prev. 47.2 (Sep)
■ Unchanged
Egypt PMI (non-oil private sector)

Egypt’s PMI unchanged at 47.2 in October as output and new orders fall faster

The tenth month below the 50.0 no-change mark. Output and new orders fell at the fastest rates in four months, employment returned to contraction and input cost inflation hit a five-month high on import, energy and shipping costs.

Published
Source: S&P Global PMIRead original
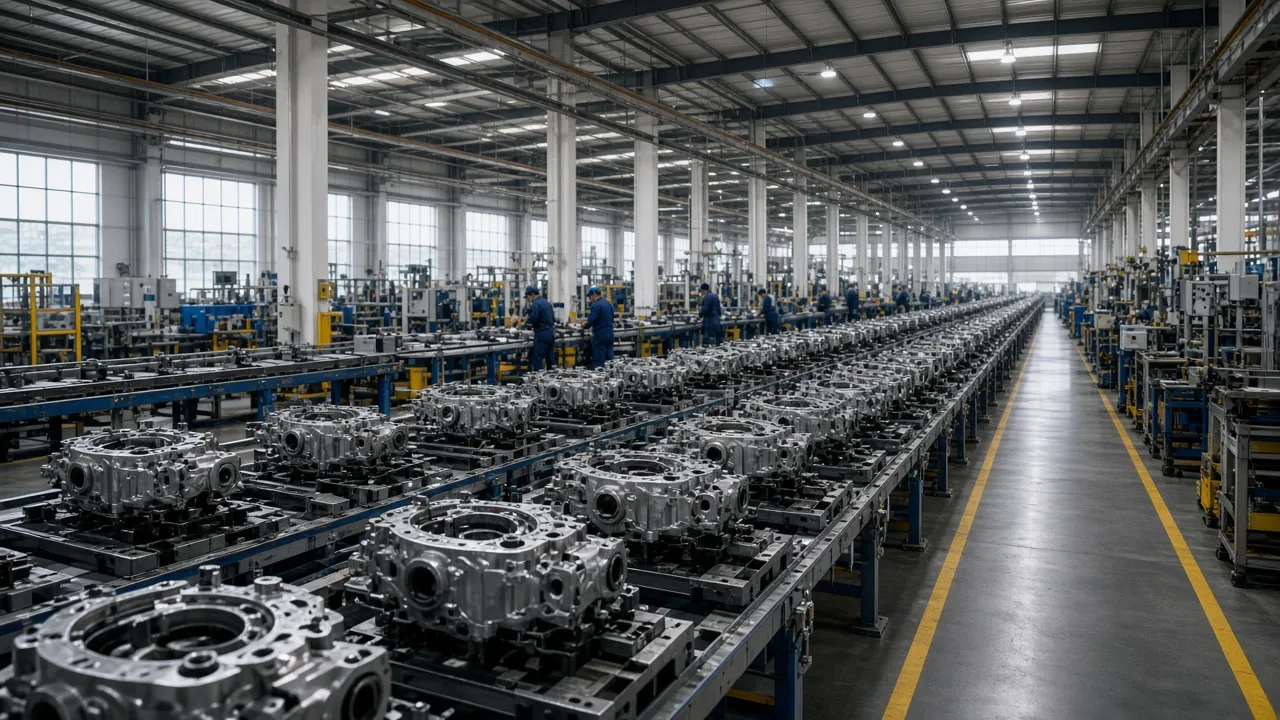
Assembly hall with conveyor lines of machined metal parts
52.6indexOctober 2026 · prev. 53.0 (Sep)
▼ Falling
J.P.Morgan Global Manufacturing PMI

Global manufacturing PMI eases to a two-month low of 52.6

Still above 50.0 for the fifteenth consecutive month. Output and new orders grew more slowly than September’s highs, while input cost inflation picked up amid material shortages and supplier delays; 19 of 29 countries raised output.

Published
Source: S&P Global / J.P.MorganRead original
Molten steel pouring from a ladle in a steel mill
142.4MtSeptember 2026 · prev. −0.2% y/y
▼ Falling
World crude steel production

World crude steel output at 142.4 Mt in September, down 0.2% year on year

Across the 70 countries reporting to worldsteel, Africa grew 10.6% to 2.2 Mt while the Middle East fell 20.4%. China produced 73.6 Mt and India 13.9 Mt; January–September output totalled 1,367.5 Mt (−0.7%).

Published
Source: World Steel AssociationRead original
Market stall with vegetables and price tags
12.7%October 2026 · prev. 13.9% (Sep)
▼ Falling
Egypt annual urban inflation

Egypt’s urban inflation slows to 12.7% in October

Headline urban inflation eased for a third month to its lowest since January, while CBE core inflation fell to 13.1% from 14.1%. Monthly core prices rose 1.2%, pointing to lingering cost pressure in non-food goods and services.

Published
Source: Enterprise (CAPMAS / CBE data)Read original
Market stall with vegetables and price tags
13.1%October 2026 · prev. 14.1% (Sep)
▼ Falling
Egypt annual core inflation

Egypt’s annual core inflation slows to 13.1% in October

Central Bank of Egypt figures show core CPI easing on an annual basis, though the monthly core rate rose to 1.2% from 0.8% in September. CAPMAS put nationwide annual headline inflation at 12.0%.

Published
Source: Arab FinanceRead original
Petrochemical plant with storage tanks
9.54$bnJanuary–September 2026 · prev. +34% y/y
▲ Rising
Chemical & fertiliser exports (Jan–Sep)

Chemical and fertiliser exports reach $9.54bn in nine months

Up from $7.14bn a year earlier, adding $2.4bn in export revenue. Fertilisers, petrochemicals and plastics led; the EU, non-Arab Asia and Arab markets were the top destinations.

Published
Source: Egypt Business (Chemical & Fertilisers Export Council)Read original

Figures are reported as published by each source on the date shown; follow the link for the full release and methodology. A PMI above 50.0 signals improvement on the previous month, below 50.0 a deterioration. Images are illustrative.